• Call: +1 (858) 429-9131

DevOps stories 1: working with a high traffic e-commerce portal

Looks like this is a good idea to write down first person stories of various DevOps – Cloud migration scenarios that we come across.

In this particular case we have a beast of a server with 32 processors with 8 cores each & 256 of RAM running LAMP stack, CakePHP &  X-cart shopping cart. And yes, everything is dead slow.

Cleaning up the X-cart cache

By default (?), the cache is at /var/www/html/cache or [DOCTUMENT_ROOT]/cache. If there are too many files, you will not be able to delete the files. The following commands can help.


touch /root/agileblaze/cache-file-list.txt #empty file
find . -name '.js' | grep -vFf /root/agileblaze/cache-file-list.txt | xargs /bin/rm -f
find . -name 'sql.
' | grep -vFf /root/agileblaze/cache-file-list.txt | xargs /bin/rm -f
find . -name 'rf*.php' | grep -vFf /root/agileblaze/cache-file-list.txt | xargs /bin/rm -f

The permanant fix for this X-cart behaviour is to change the following row in the config.php file from:

define('USE_SQL_DATA_CACHE', true);
to
define('USE_SQL_DATA_CACHE', false);

MySQL

There are tons of issues like a db that is not upgraded, joins without indexes etc. We decided to make use of the RAM & have MySQL MYISAM temporary files in there for faster access. Don’t forget to create the required directory and add the necessary entries /etc/fstab to persist the changes over reboots.

/etc/my.cnf is changed as follows

tmpdir = /var/mysqltmp # changed from /var/lib/mysql/tmp

Now that we have some room to look into other matters, things should be easier.

We also had the non-so-friendly max connections error. We increased in the max connections from the default.

# MAX CONNECTIONS
max_connections = 300 #Sat Apr 30 03:35:25 CDT 2016

Slow Queries

If the slow query log is enabled, mysqldumpslow can be a very handy command

[root@714219-db1 mysql]# mysqldumpslow -a -s r -t 10 /var/log/mysql/slow.log

Reading mysql slow query log from /var/log/mysql/slow.log Count: 376687 Time=1.63s (613441s) Lock=0.00s (36s) Rows=203657.1 (76714970948), 2users@localhost SELECT productid, COUNT(remote_ip) AS total, AVG(vote_value) AS rating FROM xcart_product_votes GROUP BY productid

Controlling the RAM usage


The RAM usage on GNU/Linux based systems can be sometimes quite weird. The immediate path taken is to play around with sysctl and tweak swappiness & may be run drop_cache.

ie,

change swappiness to say, 10 & do a cache + buffer cleanup. But these may not be very handy but the /proc/sys/vm/vfs_cache_pressure changes seems to help further. (we have it around 512)

Further minimum free memory size is a parameter which can help preventing OOM errors. A sample value is shown below.

sysctl -w vm.min_free_kbytes=2621440

Further:

sysctl -w vm.vfs_cache_pressure=1024
sysctl -w vm.swappiness=10


Keep an eye on Caches and Buffers

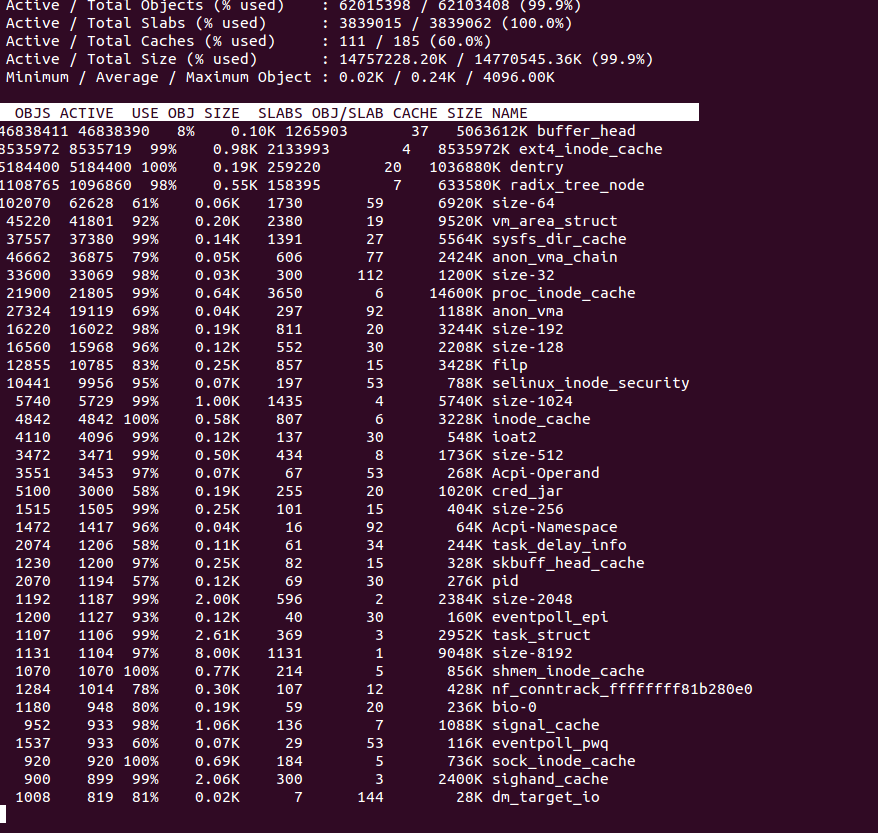
This is often something people miss.   The difference between free command and the total process usage can give us the Cache + buffer usage.  slabtop is a very handy command to get exact details.

slabtop --delay=10 -s c

Can give a neat summary.

Screenshot from 2016-05-11 20-28-07


Another very useful tool is dstat

dstat -lrvn 10 output is shown below. This can give colourful details of cache usage.

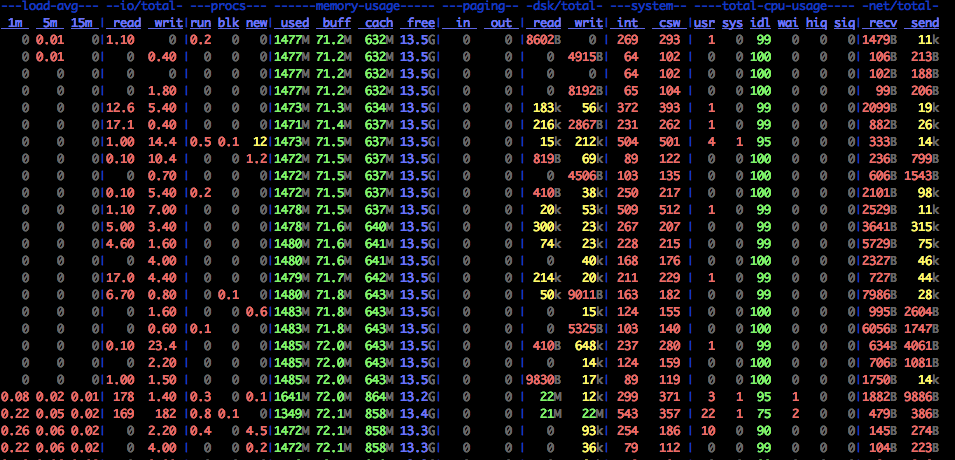
the memory, CPU, network, IO columns above gives useful information.


How to read dstat : On a fully warmed-up system, memory should be around 95% in-use, with most of it in the cache column. CPUs should be in use with no more than 1-2% of iowait and 2-15% system time.


How to setup automatic updates:

Sometimes it is quite good to have automatic updates in place. For Ubuntu, automatic updates can be done following these instructions.


PHP Caching : The way to speed up PHP sites.

     There are many sites which  is built in PHP. PHP provides the power to simply ‘pull’ content from an external source.   it could just as easily be an MySQL database or an XML file etc.

    The downside to this is processing time, each request for one page can trigger multiple database queries, processing of the output, and formatting it for display. This can be quite slow on complex sites (or slower servers).  Dynamic sites probably have very little changing content, this page will almost never be updated after the day it is written. Each time someone requests it the scripts goes and fetches the content, applies various functions and filters to it, then outputs it to you

       This is where caching can help us out, instead of regenerating the page every time, the scripts running this site generate it the first time they’re asked to, then store a copy of what they send back to your browser. The next time a visitor requests the same page, the script will know it’d already generated one recently, and simply send that to the browser without all the hassle of re-running database queries or searches.

Different Caching mechanism are discussed below.

APC

      APC stands for Alternative PHP Cache, and is a free and open opcode cache for PHP. It provides a robust framework for caching and optimizing PHP performance. APC also provides a user cache for storing application data. APC for caches that do not change often and will not grow too big to avoid fragmentation. The default setting of APC will allow you to store 32 MiB for the opcode cache and the user cache combined

Installing apc on ubuntu

#apt-get install php-apc

edit  apc.ini   ; default location on new php5 is –> /etc/php5/conf.d/20-apc.ini

extension = apc.so;  uncomment this line   
apc.shm_segments=1;   ( by default its enabled .. give 0 to disable)

you can customize your values here. for getting the default values install php5-cli and from command line run

#php -i | grep apc

For monitoring apc cache hits and miss, apc providing a php script. which is located at /usr/share/doc/php-apc/apc.php. Copy this file to your document root and you will be able to monitor your apc status.

http://localhost/apc.php

for performance benchmarking we created two php files

test1.php

<?php 
         $start = microtime(true);
         for ($i = 0; $i < 500000; $i++)
             {
                include('test_include.php');
             }
         $end = microtime(true);          echo "Start: " . $start . "<br />";
         echo "End: " . $end . "<br />";
         echo "Diff: ". ($end-$start) . "<br />";
?>

test2.php

<?php
          $t =    "migrate2cloud";
 ?>

Without apc…

Start: 1360937874.8965 
End: 1360937883.1506 
Diff: 8.2541239261627

With apc..

Start: 1360937935.5746 
End: 1360937936.7291 
Diff: 1.1545231342316

 without apc it took 8 seconds to complete the request .. with apc.. 1.15 seconds..

Memcached

        Memcached system uses a client–server architecture. The servers maintain a key–value associative array; the clients populate this array and query it. Keys are up to 250 bytes long and values can be at most 1 megabyte in size. Clients use client-side libraries to contact the servers which, by default, expose their service at port 11211. Amazon provides a Service called Amazon elasticache for memcache through which we can configure memcache clusters for caching purposes.

installation and configuration

apt-get install memcached 
apt-get install php5-memcached

enable memcache module in /etc/php5/apache2/conf.d/20-memcached.ini  or in php.ini

edit php.ini 
session.save_handler = memcached 
extension=memcache.so
extension=memcached.so

Restart apache and memcache..

php script used for memcache testing..

 
<?php
//memcached simple test  
$memcache = new Memcache;
$memcache->connect('localhost', 11211) or die ("Could not connect");
$key = md5('42data');  //something unique  
for ($k=0; $k<5; $k++) {
$data = $memcache->get($key);
    if ($data == NULL) {
       $data = array();
       //generate an array of random shit  
       echo "expensive query";
       for ($i=0; $i<100; $i++) {
           for ($j=0; $j<10; $j++) {
               $data[$i][$j] = 42;  //who cares  
           }
       }
       $memcache->set($key,$data,0,3600);
    } else 
 {
       echo "cached";
    }  } 

You can monitor memcache using phpmemcacheadmin

http://code.google.com/p/phpmemcacheadmin/

Varnish – Cache

Varnish has a concept of “backend” or “origin” servers. A backend server is the server providing the content Varnish will accelerate. Our first task is to tell Varnish where it can find its content. open the varnish default configuration file. Iif you installed from a package it is probably /etc/varnish/default.vcl.

Somewhere in the top there will be a section that looks a bit like this.:

backend default { .host = "127.0.0.1"; .port = "80"; }

Change the port number to your apache ( or whatever the webserver you are using) port number.

this piece of configuration defines a backend in Varnish called default. When Varnish needs to get content from this backend it will connect to port 80 on localhost (127.0.0.1).

# varnishd -f /etc/varnish/default.vcl -s malloc,1G -T 127.0.0.1:2000 -a 0.0.0.0:80

The -f options specifies what configuration varnishd should use.

The -s options chooses the storage type Varnish should use for storing its content

-T 127.0.0.1:2000 — Varnish has a built-in text-based administration interface

-a 0.0.0.0:80 — specify that I want Varnish to listen on port 80

For logging varnish — In terminal window you started varnish type varnishlog

When someone accessing your page you will get log like

#varnishlog
11 SessionOpen c 127.0.0.1 58912 0.0.0.0:80 
11 ReqStart c 127.0.0.1 58912 595005213 
11 RxRequest c GET 
11 RxURL c / 
11 RxProtocol c HTTP/1.1 
11 RxHeader c Host: localhost:80
11 RxHeader c Connection: keep-alive

Where not to use Caching

          Caching should not be used for some things like search results, forums etc… where the content has to be upto the times and changes depending on user’s input. It’s also advisable to avoid using this method for things like a Flash news page, in general dont use it on any page that you wouldn’t want the end users browser or proxy to cache.